Ions Visualization
Background
The above example shows a coordination visualization in D3 using the Live properties architecture of Improvise software. The data for the following visualization is taken from ions visualization.
Interface
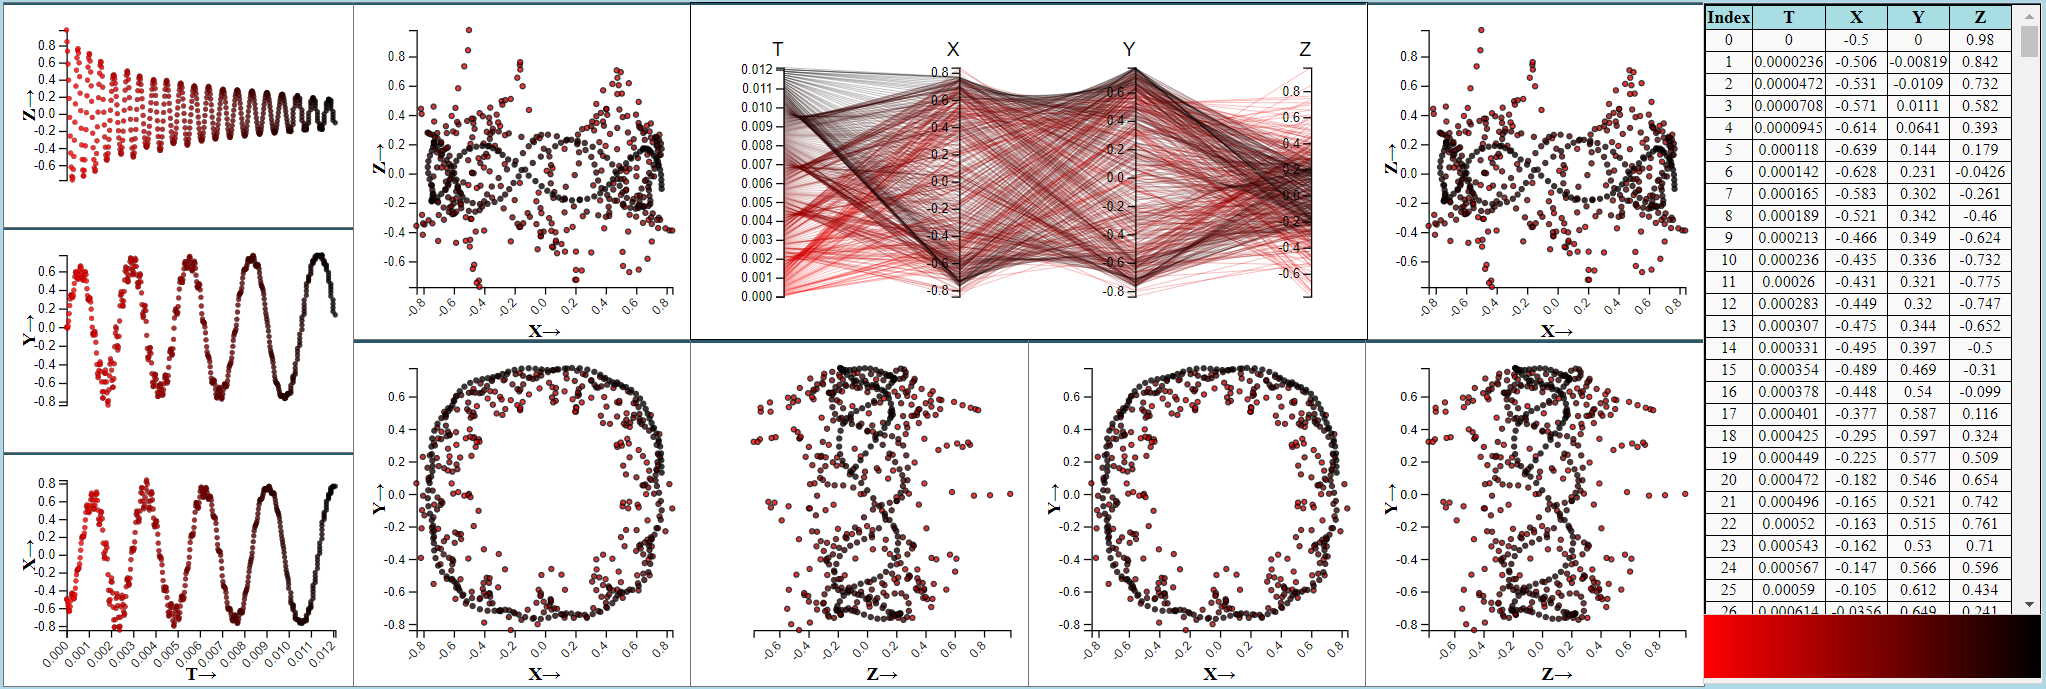
Clicking on the image shown above will open the visualization in a new window. The visualization displays different spatial and temporal aspects of a simulated ion cloud trajectory organized column wise. A highly coordinated set of timeseries plots, table views and other views reveal different characteristics of oscillatory motion. The trajectory is displayed in a variety of ways by the views in the visualization. Each view is embedded in a rectangular region with a thick border on the top. Each view can be independently moved, and the interface can be reorganized by clicking and dragging the thick border on the top of each view.
- The first column from left consists of three time series scatter plots that show ion motion over time relative to X, Y and Z axis.
- The second, third, fourth and fifth columns consists of scatter plots drawn in a combination of different axis.
- The third column and fourth column consist of a parallel coordinate plot that shows the data in all the dimensions.
- The sixth column from the left shows a table view with the actual (T, X, Y, Z) positions of points along the trajectory.
- The sixth column from the left below the table view shows a perpetual view with a color gradient mapped on to a rectangular region.
All views map time into a translucent red-to-black color gradient that suggests (but does not map precisely to) decreasing energy of the ion cloud over time.
Coordination
- The three scatter plots in the first column and the table view are coordinated in selection.
- The three scatter plots in the first column are connected in range along horizontal axis.
- The scatter plots in the second and third column from left consists of overview scatter plots for the detailed views in the scatter plot in fourth and fifth columns. The Top scatter plot in the second column and the top scatter plot in the fifth column are overview-detail pairs. The bottom scatter plot in the second column and the bottom scatter plot in the fourth column are overview and detail pairs. The bottom scatter plot in the third column and the bottom scatter plot in the fifth column are overview and detail pairs.
- The parallel coordinate plot and the perpetual slider are coordinated in selection.
Interaction
Scatter plot
The current implementation supports either zoom or brush on the scatter plot at a time. we decided to implement brush property instead. Brushing can be done in the scatterplot view by clicking the mouse anywhere on the scatterplot followed by drag and release to select a brushed region. Brushing in the above implementation is performed using rectangular brushed regions. Any items that fall in the brushed region are selected. Selected items are shown in the scatter plot using a black colored stroke. Brushing on the scatter plots in the first column will select items in the coordinated views to the plot on which the brushing is performed. Brushing performed on any of the overview plot will draw a detailed plot for the brushed region. Brushing performed on the detailed view will not have any effect as no coordination is defined for the brushing action.
Parallel coordinate plot
The above parallel coordinate plot does not allow selection or hovering. It will only display selected items from a corresponding coordinated view. The selected items are drawn using thick lines.
Table view
Selection in table view is done by double clicking on the row for selecting a single element. For selecting multiple rows click on a row and drag the mouse to the top or bottom based on the direction in which the selection is to be made. There are performance issues associated with multi row selection in case of table view in the current implementation which will be addressed later which causes the multiple selection to not perform consistently. The selected rows have a red colored text font. The table view and the scatter plots in the first column are coordinated in selection.
Perpetual slider
The perpetual slider and the parallel coordinate plot are coordinated in selection. Selection is performed in the perpetual slider by brushing. The slider is filled with a color gradient approximately corresponding to increasing time scale in the data. Any selection performed in the slider will select the corresponding data points in the linked parallel coordinate plot.

